PingCAP is a global company focused on developing distributed, high-performance, and auto scaling relational databases. Its flagship product, TiDB, is a popular open source databases, and TiDB Cloud, a fully managed Database-as-a-Service (DBaaS) based on TiDB, delivers horizontal scalability, strong consistency, and high availability for high-performance applications.
Many PingCAP customers run highly latency-sensitive workloads such as financial or payment systems using TiDB Cloud. To provide high performance, TiDB Cloud is deployed on Amazon Elastic Kubernetes Service (Amazon EKS) using Amazon Elastic Block Store (Amazon EBS) as the underlying storage. Amazon EBS provides high performance block storage, and its top performing EBS volume type, io2 Block Express, is designed to deliver an average latency under 500 microseconds for 16 KiB I/O operations. When compared to Amazon EBS General Purpose gp3 volumes, io2 Block Express also offers significantly lower outlier latency by reducing I/O operations exceeding 800 ms by more than ten times. To provide consistent high performance, PingCAP finds it essential to monitor real-time performance at the different layers of the application stack, including storage, to quickly react to any incidents that may disrupt the application.
In this post, we use an open source TiDB deployment environment as an example to demonstrate how TiDB Cloud uses Amazon EBS detailed performance statistics to enhance Amazon EBS monitoring capabilities. System administritors and database administrators can refer this post to set up their own monitoring system to monitor Amazon EBS performance for deeper insights, helping to increase system stability and business continuity.
Solution overview
A TiDB cluster can be impacted due to slight fluctuations in the performance of read and write operations on an EBS volume. Before the launch of the Amazon EBS detailed performance statistics, we could only capture the average I/O latency through the previously available monitoring tools. They did not give us visibility into the latency outliers that only a small number of I/O experienced, because this became hidden among the other thousands of I/O that were performing within expectations. Therefore, when all of these I/O were averaged over the period, the volume performance was reported as normal, and we couldn’t attribute the increased latency on the TiDB cluster to these outliers and take the right corrective measures to reduce the impact.
Amazon EBS provides real-time, high-resolution I/O performance statistics for volumes attached to Nitro-based Amazon Elastic Compute Cloud (Amazon EC2) instances through the NMVe Log interface. You can collect these statistics at a granularity of down to 1 second, which also include latency histograms that show the spread of I/O latency. Using these metrics, PingCAP was able to monitor volume performance at a more granular level. From the latency histograms, we captured the p99 I/O latency, which allowed us to trigger a failover whenever we saw these high outlier latencies impacting the performance of the leader partition in the TiDB cluster, as shown in the following figure.
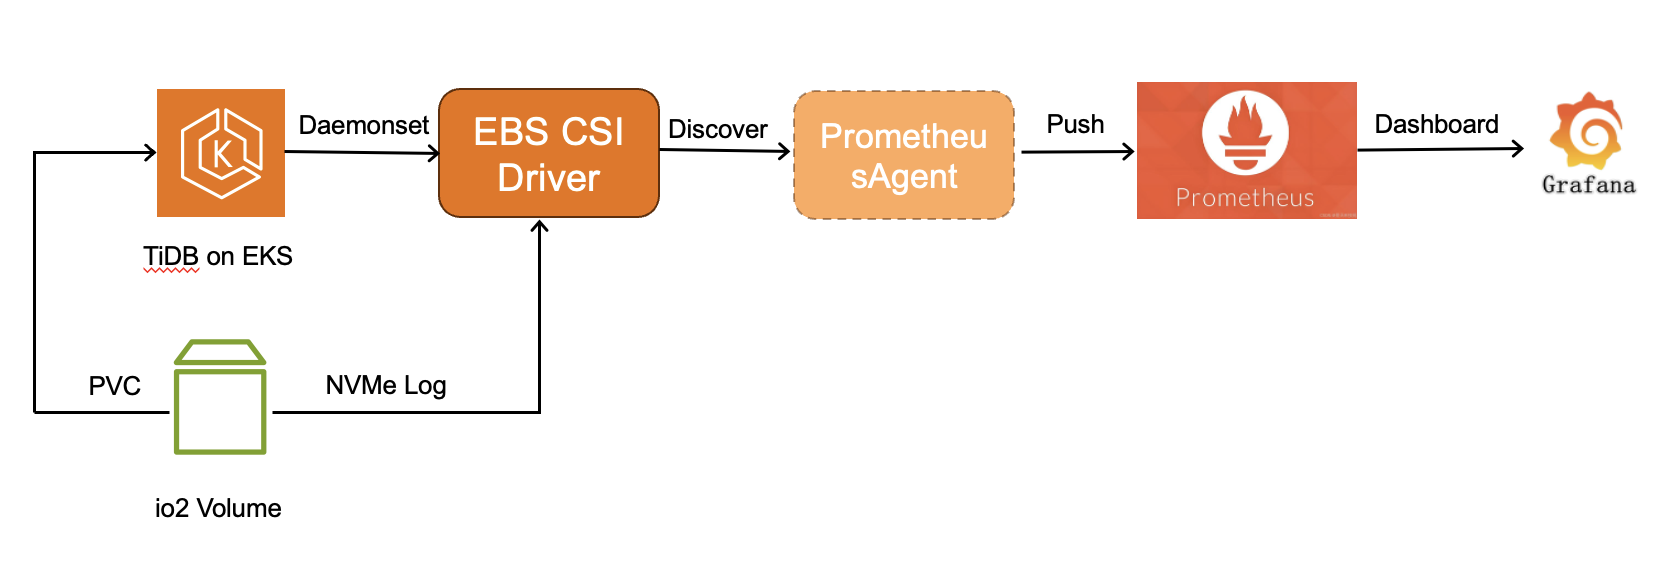
Figure 1: Monitoring detailed EBS performance metrics on EKS
Usually, customers may already have their own OS monitoring systems, such as node_exporter from Prometheus project. However, Amazon EBS detailed performance statistics have several advantages:
- As mentioned previously, they provide I/O latency histogram statistics, which can be used to identify a single I/O with high latency compared.
- They provide IOPS and throughput exceeded metrics at both the Amazon EC2 and Amazon EBS level while OS monitoring tools aren’t aware of this. We can use these metrics to identify when an instance or a volume is hitting its performance limits and quickly distinguish where the performance bottleneck lies.
- They measure the latency in correct I/O size from a block storage point of view, while the OS monitors a large I/O from the application point of view. This is split into the small I/O size by Linux kernel, and one original single large I/O shows higher latency. Furthermore, it only shows the pure I/O service time on the volume by removing the I/O queuing time on the OS I/O scheduler.
Prerequisites
For this walkthrough, you should have the following prerequisites:
- Helm 3, to install TiDB Operator
- Amazon Web Services (AWS) eksctl, to deploy the TiDB on Amazon EKS
- Amazon EBS CSI Driver with version 1.37.0+, which provides Amazon EBS with detailed performance metrics
- The EC2 instance must be on the AWS Nitro-based system.
Walkthrough
Follow these steps to set up the monitoring and failover mechanisms:
- Enable the Amazon EBS CSI Driver add-on in Amazon EKS. TiDB deploys multiple servers on different EKS nodes to provide high availability and high TPS in a distributed environment. It can automatically scale out and rebalance data when the workload increases.
- Validate the metrics collection. The CSI driver is deployed on each node as a daemonset deployment. It collects the Amazon EBS detailed performance statistics and emits them under IP:PORT:3302/metrics.
- Prometheus integration configuration. Configure open source Prometheus or Amazon Managed Service for Prometheus, point the data source or workspace to the preceding Amazon EBS metrics.
- Deploy Prometheus agent for production monitoring. For the production system, deploy the Prometheus agent with pods and discovery service. The agent scrapes the statistics and forwards them to the Prometheus database TSDB.
- Grafana dashboard development. Configure open source Grafana or Amazon Managed Grafana, and set up the dashboard template to display the Amazon EBS metrics.
- Set the proper failover threshold in the TiDB Raft group. Use a different formula to show the metrics in the Grafana GUI and set up an alert rule to trigger the TiDB failover if the leader partition degrades in the Amazon EBS performance.
Detailed steps
Step 1: Enable Amazon EBS CSI Driver add-on
- Navigate to the Amazon EKS console and choose your target cluster. This opens the cluster management console where you can configure various add-ons and settings.
- In the cluster dashboard, choose the Add-ons tab, then choose Get more add-ons to browse available extensions. If the Amazon EBS CSI Driver is already installed, then you should find it in the add-on list.
- From the add-ons catalog, locate and choose Amazon EBS CSI Driver.
- Configure the Add-on Settings.
This step needs two critical configurations:
– Version selection: Choose version v1.37.0-eksbuild.1 or higher version.
– Enable metrics collection: Expand the Optional configuration settings section and add the following configuration in the Configuration values field:
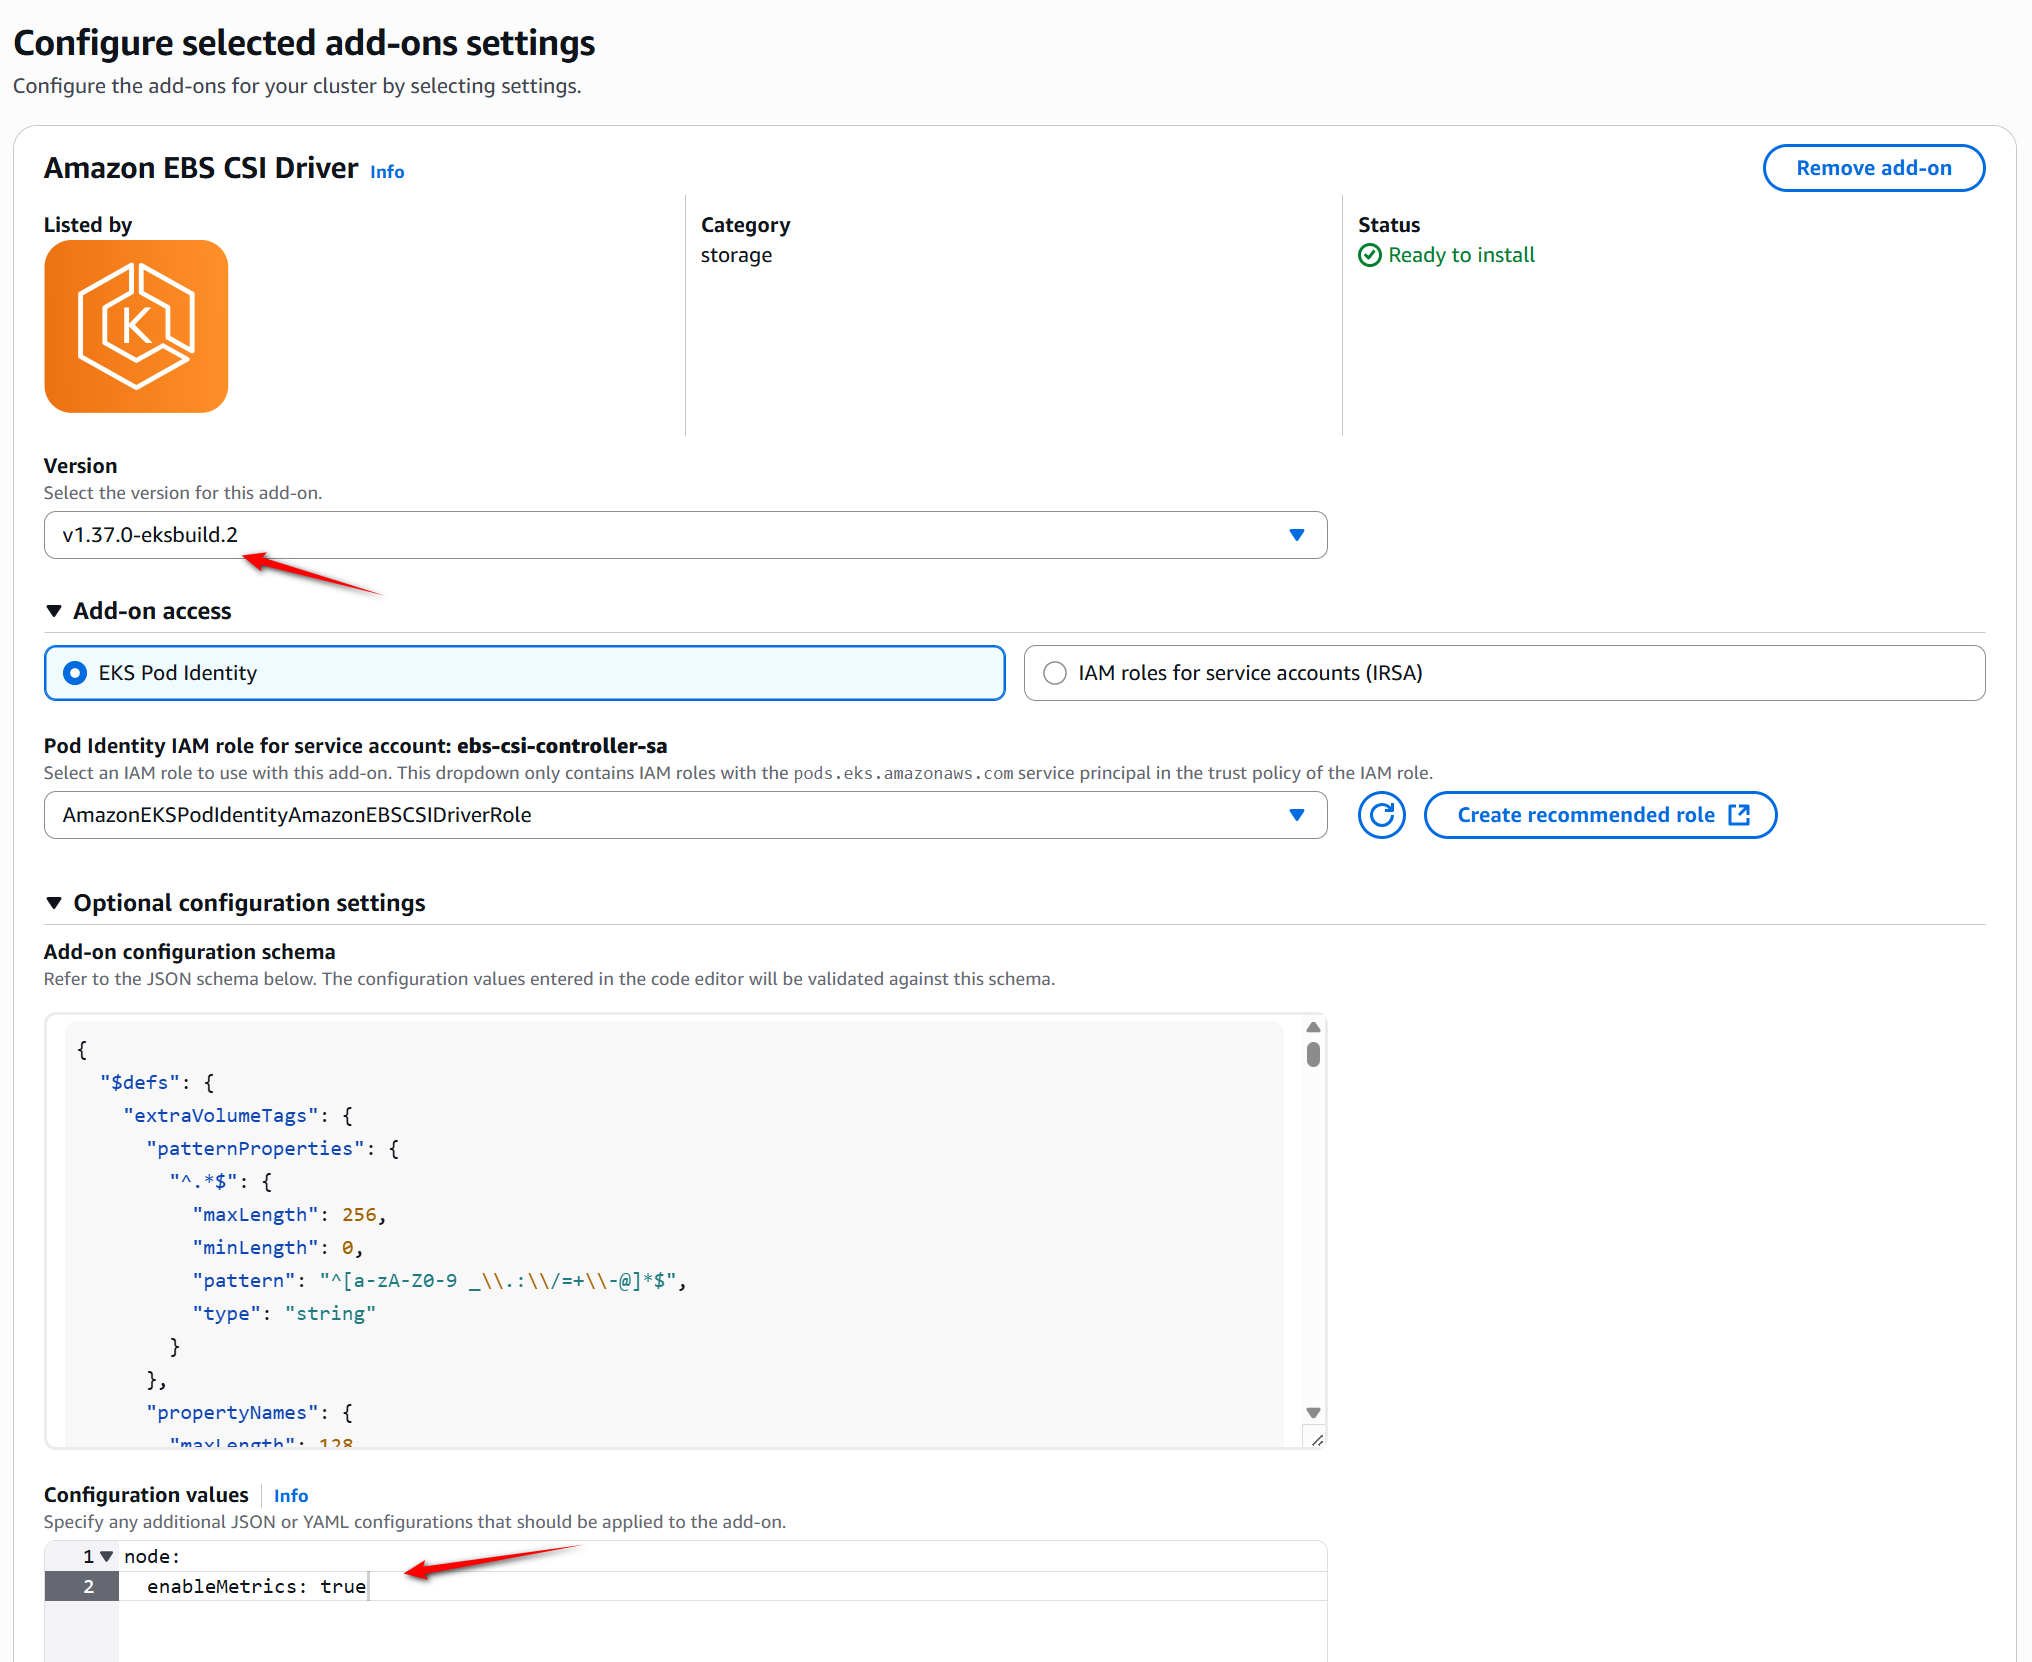
Figure 2: This configuration parameter activates the NVMe metrics collection feature within the CSI driver.
- Proceed to the next page and choose Create to finalize the add-on installation. When completed, the Amazon EBS CSI Driver add-on status should display as Active in your add-ons list, indicating successful deployment and configuration, as shown in the following figure.
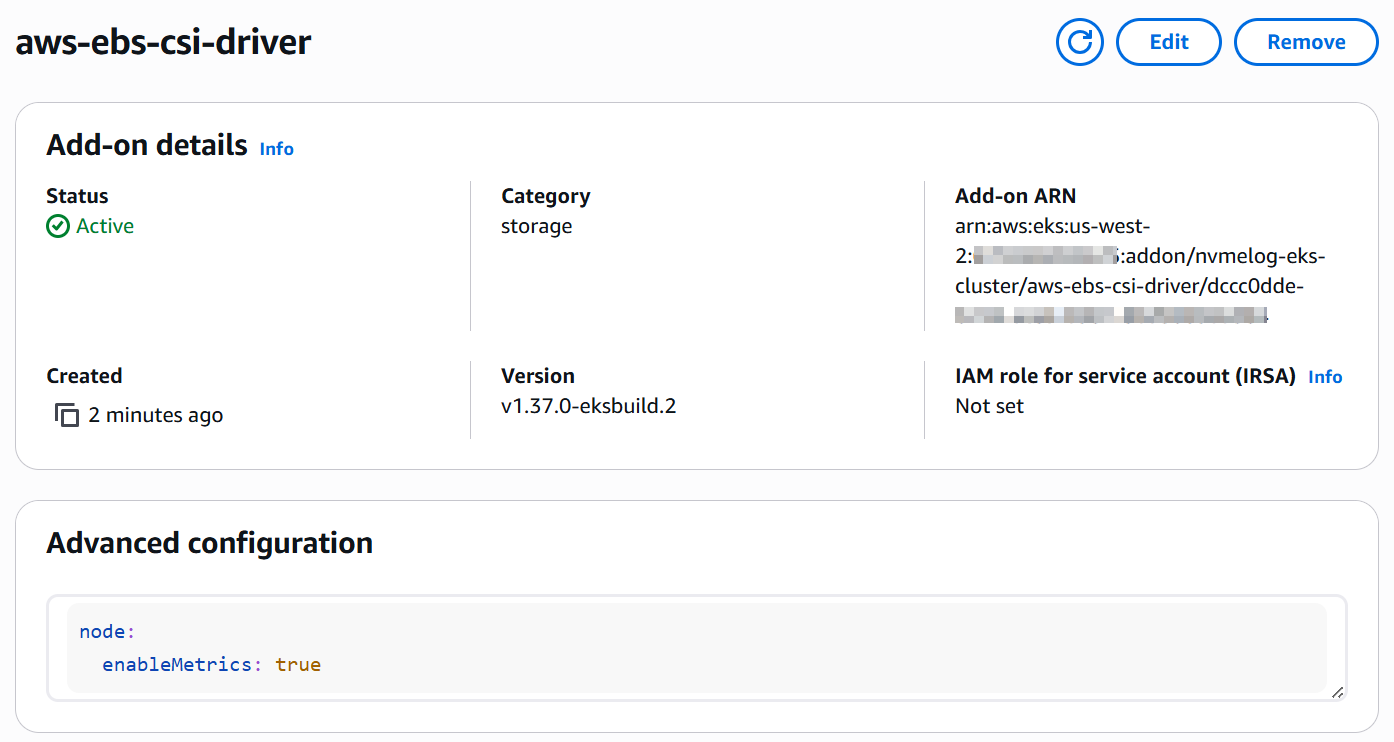
Figure 3: Amazon EBS CSI Driver status displayed as active
After enabling the Amazon EBS CSI Driver, Amazon EKS automatically deploys controller and node pods across your cluster. You can use the execute kubectl command to get the Amazon EBS CSI pods detail:
The ebs-csi-controller pods manage volume operations, while ebs-csi-node pods run on each worker node to handle local volume attachments and metrics collection.
Step 2: Validate metrics collection
- Get the metrics from the Amazon EKS pod, or
- Get the metrics from the EKS node through port forwarding
Before integrating with Prometheus, you must verify that the CSI driver is working correctly by collecting NVMe metrics.
- Direct pod access method:
You can access the metrics endpoint directly using the CSI node pod IP address:
- Port forwarding method:
Alternatively, establish a port forward for local access:
A successful configuration returns Prometheus-formatted metrics as shown in the following example:
These metrics provide detailed insights into NVMe device performance, including:
Step 3: Prometheus integration configuration
- Prometheus directly connects to the pod, or
- Use agent-based collection
With metrics collection verified, the next step involves configuring Prometheus to scrape these metrics automatically. The finest granularity is down to a 1 s interval.For production environments, we recommend using Prometheus agents to collect metrics data and forward to Prometheus. This approach provides better scalability and reliability when compared to direct Pod scraping. You can choose between the following two options:
Option 1: Direct Prometheus configuration (simple setup)Add the following job configuration to your prometheus.yml file:
• Replace ‘POD-IP’ with the actual IP addresses of your ebs-csi-node pods for direct configuration.
• Adjust scrape_interval based on your monitoring requirements and cluster workload.
After updating the configuration, restart your Prometheus service to apply the changes. If you choose this option, then you can skip Step 4 and proceed directly to Step 5.
Option 2: Agent-based collection (recommended for production)
For production environments, deploy a collection agent in your EKS cluster to automatically discover and scrape metrics, then forward to your Prometheus server.
Agent benefits:
• Automatic service discovery eliminates static IP configuration
• Built-in retry mechanisms provide data reliability
• Reduced load on external Prometheus server
• Better security isolation within the clusterIf you choose this production-ready approach, then continue with Step 4 for detailed agent deployment instructions.
Step 4: Deploy Prometheus agent for production monitoring
- Create the Account and Permission
- Create Amazon EKS configMap and agent configuration
- Deploy the agent pod on Amazon EKS
- Verify the deployment by getting the metrics
The following steps guide you through deploying a Prometheus Agent that uses Kubernetes service discovery to automatically find the Amazon EBS CSI node pods and forward all NVMe metrics to your external Prometheus server.
Agent deployment steps:
- Create service account and permissions
- Configure agent settings
Create a ConfigMap with the agent configuration:
Deploy the Agent
- Verify agent operation
The agent automatically discovers ebs-csi-node pods using Kubernetes service discovery and forwards all NVMe metrics to your external Prometheus server. This eliminates manual IP configuration and provides automatic failover when the pods restart.
Step 5: Grafana dashboard development
- Set up dashboard with the Amazon EBS metrics
This step involves creating comprehensive dashboards in Grafana to visualize the collected metrics effectively. For example, the p99 latency metric formula is as follows:
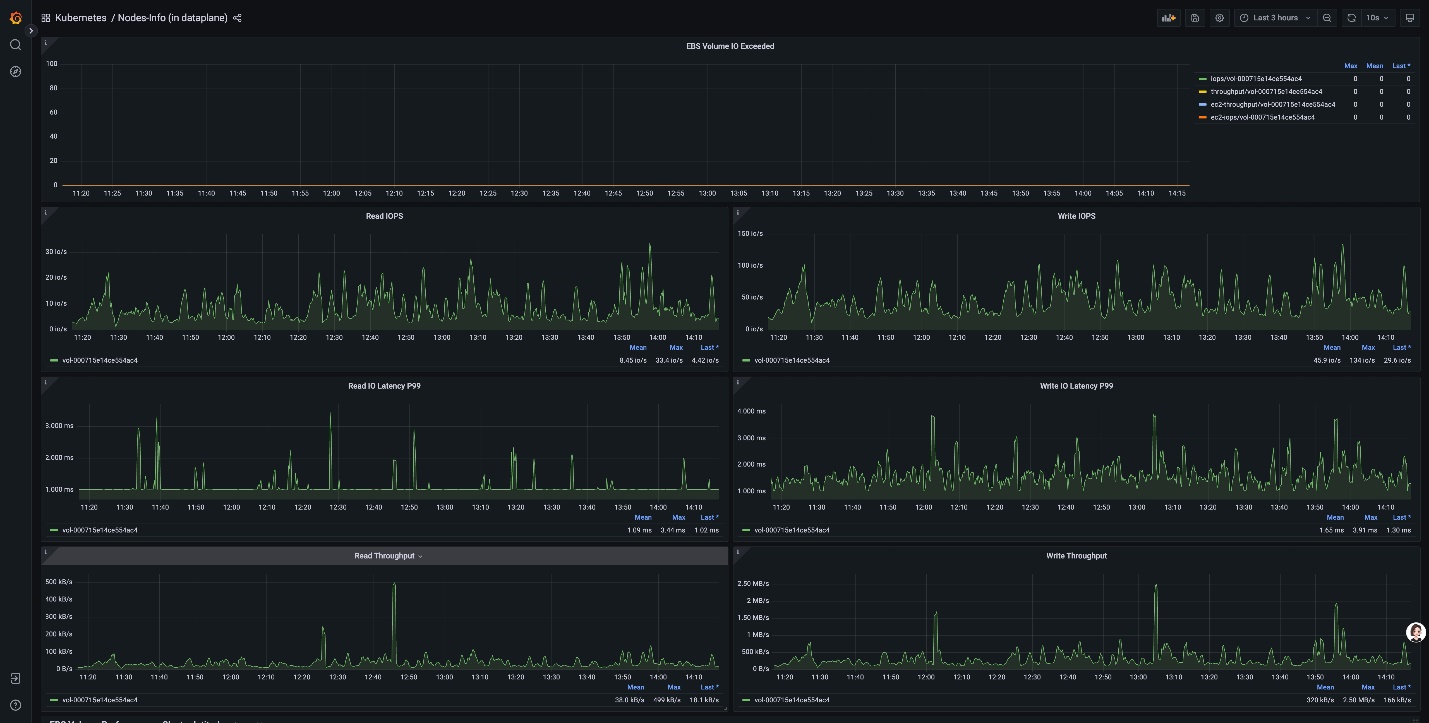
Figure 4: Grafana dashboard with metrics visualized
Step 6: Set the proper failover threshold in the TiDB Raft group
- Set the failover threshold in latency and duration
TiDB is a distributed database based on Raft Protocol. If the leader partition experiences high p99 I/O latency, then we can trigger the failover to provide business continuity and stability. Set up the proper latency thresholds based on your business requirements. Furthermore, monitor the IOPS/throughput exceeded metrics to identify performance bottlenecks.
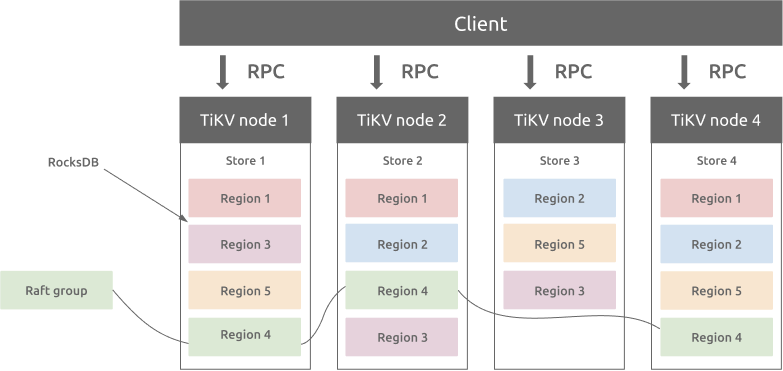
Figure 5: TiDB partition architecture
Cleaning up
To avoid unnecessary charges, you can remove the EKS Cluster:
- Go to the EKS console, select the created cluster above, and click “Delete” command. This will delete the cluster resources, including the EBS CSI driver and EBS PV volume and Prometheus agent.
- From Grafana GUI, delete the EBS Metric dashboard.
Conclusion
Databases are extremely sensitive to I/O latency, and our previous monitoring systems in the TiDB Cloud could only provide coarse-grained data, averaged at the minute level, which made it difficult to capture critical I/O performance fluctuations. We implemented Amazon EBS detailed performance statistics in our TiDB Cloud infrastructure and achieved real-time I/O monitoring. This enabled us to immediately detect subtle changes in storage performance. We used these high-precision metrics to quickly identify potential issues and take timely optimization measures, significantly improving the end-user service experience for TiDB Cloud customers. Moreover, the more granular and comprehensive performance metrics gave us valuable data that we could use for our TiDB Cloud design and performance testing efforts.