
Kubernetes Blog The Kubernetes blog is used by the project to communicate new features, community reports, and any news that might be relevant to the Kubernetes community.
-
Why Is My Kubernetes Job Still Pending? Tracing Kueue Admission with Headlamp
 on October 14, 2026 at 6:35 pm
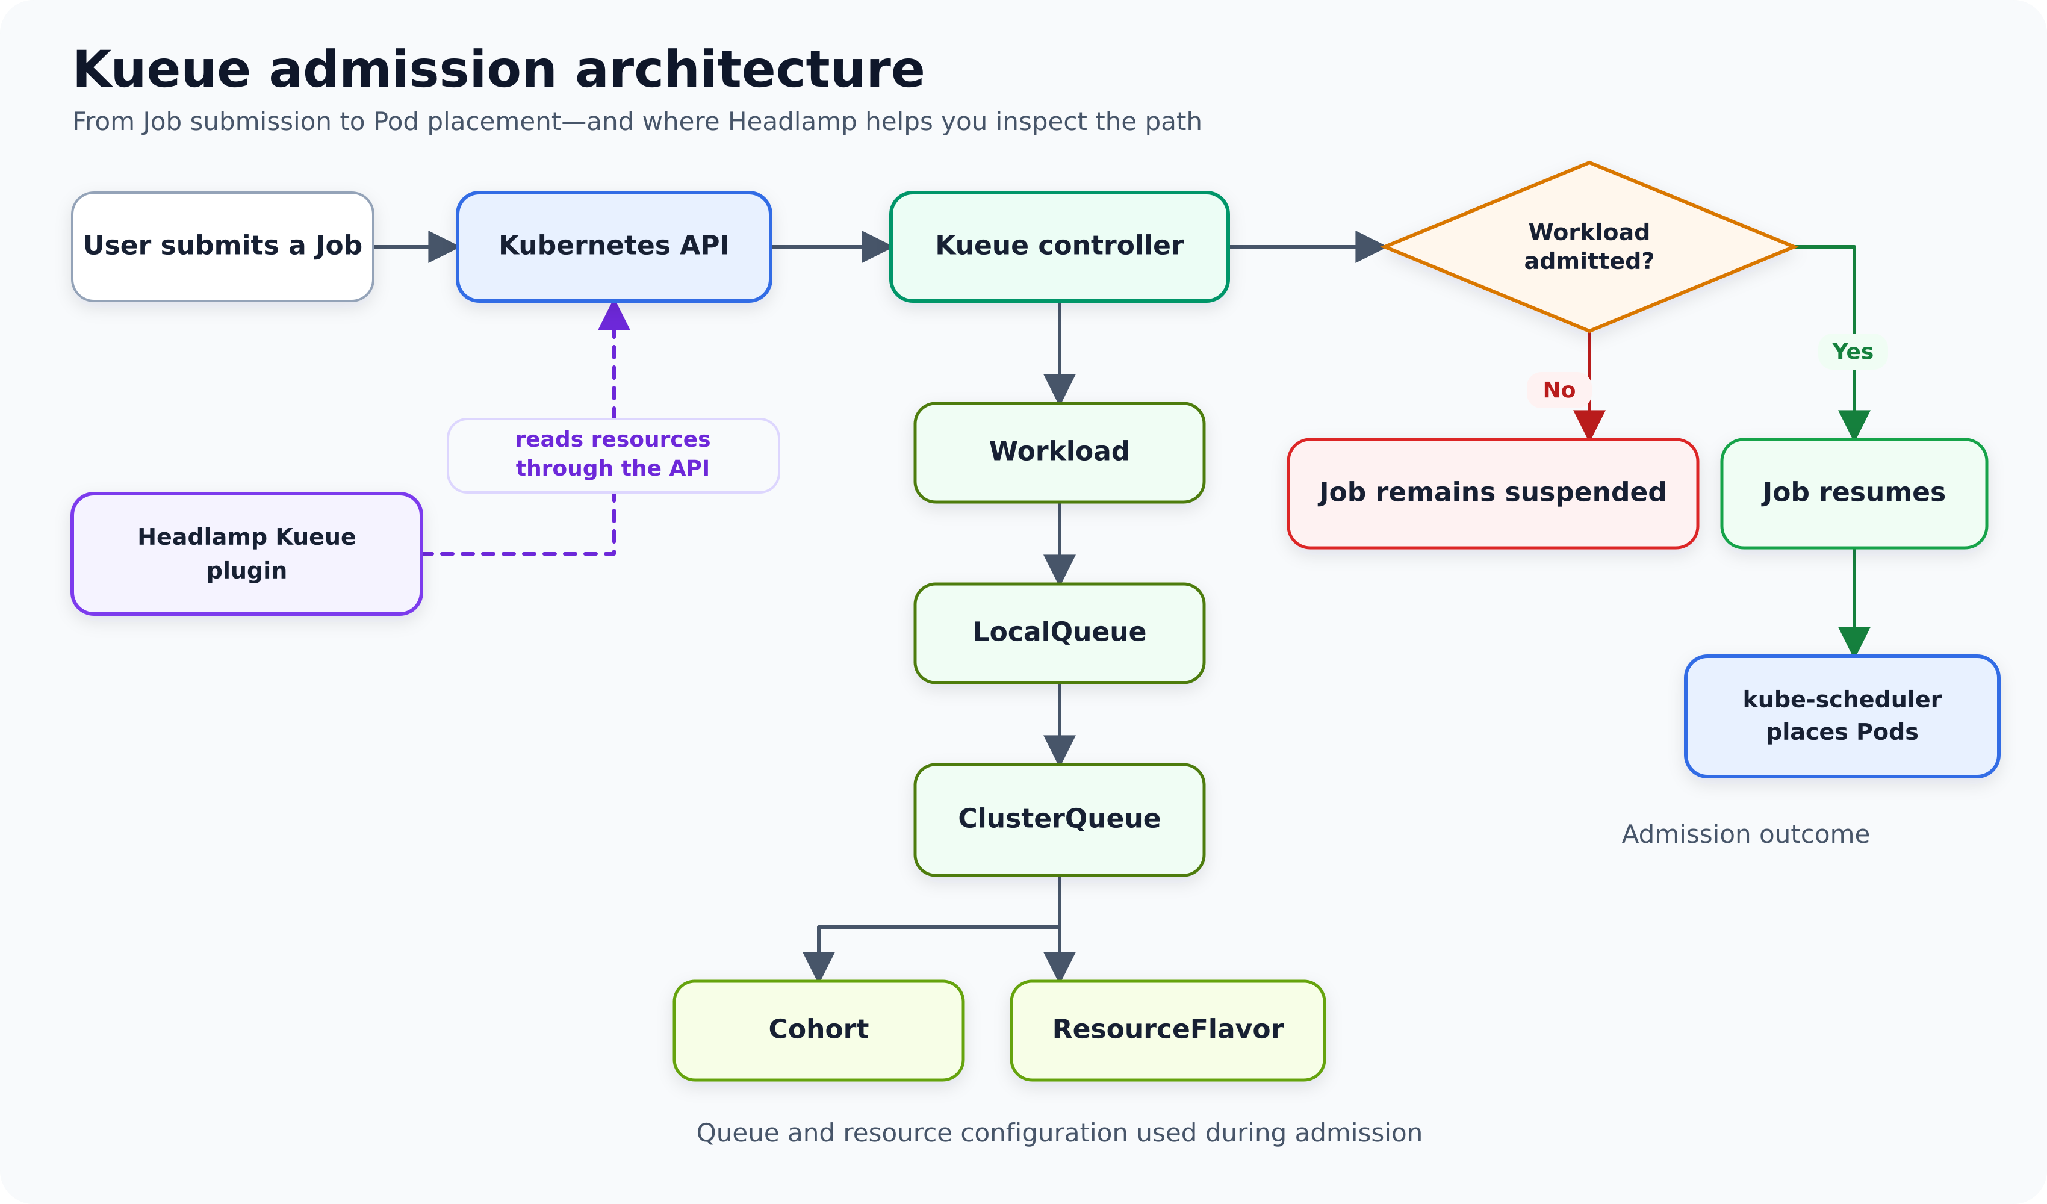
You submit a Kubernetes Job and wait for its Pods to appear. A minute passes. Then another. The Job is still suspended, there are no application logs, and there may not even be a Pod to inspect. In a cluster managed by Kueue, this can be completely normal. Kueue may still be deciding whether the Job can use the requested resources. The useful question is not only “Why is the Pod pending?” It is first “Has Kueue admitted the Workload?” The Kueue plugin for Headlamp brings that investigation into the Headlamp UI. Instead of reconstructing the admission path from several commands and large YAML objects, you can begin with the Workload, read its condition message, and follow links through the LocalQueue, ClusterQueue, ResourceFlavor, and Cohort. This article follows that Headlamp-first path. The command line appears only in a short optional section for reproducing the example. Before you beginYou need a Kubernetes cluster with Kueue installed, a Headlamp installation, and the 0.1.0-alpha Kueue plugin. Your Kubernetes identity must be allowed to read the Kueue resources used in this article. The alpha release provides read-only views for Kueue v1beta2 Cohorts, ClusterQueues, LocalQueues, ResourceFlavors, and Workloads. It does not add its own create, edit, stop, resume, or delete workflows. Headlamp still provides its standard YAML and resource actions where your permissions allow them. First, separate admission from Pod schedulingKueue and the Kubernetes scheduler answer different questions. Kueue admission: Should this Workload start now, considering queue policy, quota, ResourceFlavors, admission checks, and other waiting Workloads? Pod scheduling: After the Workload is admitted and the Job resumes, which nodes can run its Pods? That boundary changes the investigation. If the Workload is not admitted, stay in the Kueue section of Headlamp. If it is admitted but its Pods are still Pending, move to Headlamp’s normal Job and Pod views and inspect scheduler events. Kueue admission architecture The Headlamp-first troubleshooting pathThe quickest investigation starts with the Workload, not with a shell. Tracing a pending Job through Headlamp Step 1: Open the Workloads viewIn Headlamp, open Kueue → Workloads. Select the namespace that contains the Job, then find the Workload created for it. Kueue creates a Workload to represent the resource request and admission state of a Job. In the alpha plugin, owner references are shown as Kind/name text but are not yet clickable. The Workload name normally contains the Job name, so the namespace filter and table search are the simplest ways to locate it. Before opening the detail page, the list already gives you a useful first scan: LocalQueue priority and priority class active state admitted state completion state a readable current status such as Admitted, Finished, or Inadmissible age If there is no matching Workload, check three things before going further: the selected namespace, whether the Job was submitted to a LocalQueue, and whether your Kubernetes account can list Workloads. The plugin performs permission checks and displays an access message when the current identity cannot read a resource. Step 2: Read status, conditions, and eventsOpen the Workload. Start with its current status and conditions, not with the full YAML. For admission troubleshooting, the most important condition types are QuotaReserved and Admitted. Admitted=True means Kueue has admitted the Workload. The Job can resume, so any remaining Pending Pods belong to the scheduling branch of the investigation. QuotaReserved=False with a reason such as Pending means Kueue has not reserved quota. The condition message explains what prevented the reservation. An Inadmissible status means the Workload currently cannot fit the available queue configuration. A missing covered resource, unsuitable ResourceFlavor, stopped queue, or admission check can all lead you here. For example, a condition message may report that Kueue could not assign a ResourceFlavor because the ClusterQueue has insufficient CPU quota. That message is the first real answer to “Why is my Job still pending?” The rest of the Headlamp journey explains the configuration behind it. Also check the Events section. Conditions describe the current state; events help show what recently changed or what Kueue attempted. Step 3: Compare the Workload’s request with its assignmentStay on the Workload detail page and inspect the PodSets and resource requests. The plugin shows the requested Pod count, CPU, memory, and other resources that Kueue evaluates together. This matters because a Job with parallelism: 3 and a one-CPU request per Pod asks Kueue for three CPUs in total. Looking at only one Pod’s template would underestimate the Workload. If quota has already been reserved, the same page also shows the assigned ClusterQueue, ResourceFlavors, and admitted resource usage. If those admission assignments are absent, the Workload has not reached that point yet. In our example, the Workload requests: three Pods three CPUs in total 600 MiB of memory in total The next question is where that request entered Kueue. Step 4: Follow the linked LocalQueueUse the LocalQueue link on the Workload detail page. A LocalQueue is the namespace-level entry point used by the Job. It connects namespaced Workloads to a cluster-scoped ClusterQueue. The LocalQueue page shows: its namespace and connected ClusterQueue stop policy and current status pending, reserving, and admitted Workload counts Kueue conditions and Kubernetes events related Workloads in the same namespace This page answers two practical questions: Did the Job enter the queue you expected, and is it the only Workload waiting there? If the LocalQueue is inactive or stopped, that may already explain the wait. If it is active, follow the linked ClusterQueue to inspect the capacity behind it. Step 5: Inspect ClusterQueue capacity and usageA ClusterQueue represents the cluster-level quota and admission policy available to one or more LocalQueues. On its Headlamp detail page, compare the Workload request with: covered resources nominal quota for each ResourceFlavor current reservations and usage borrowing and lending limits pending, reserving, and admitted Workload counts queueing strategy and stop policy preemption, fair-sharing, flavor-fungibility, and admission-check settings Kueue conditions and Kubernetes events For the example in this article, the ClusterQueue provides a nominal quota of two CPUs and two Pod slots. The Workload asks for three of each. The condition message and the ClusterQueue page now tell the same story: the Workload does not fit, so Kueue leaves the Job suspended. This is an admission-capacity problem. It is not evidence that kube-scheduler failed to find a node. Step 6: Check ResourceFlavor and Cohort when neededQuota is not always a single pool. A ResourceFlavor can represent a class of compute through node labels, taints, tolerations, or topology settings. Use the ResourceFlavor link from the ClusterQueue when the condition mentions flavor assignment or when the Workload requires a particular hardware class, such as GPU nodes. If the ClusterQueue belongs to a Cohort, follow that link too. Cohorts let ClusterQueues share unused quota. The Headlamp page shows parent and child Cohorts, member ClusterQueues, referenced ResourceFlavors, resource groups, borrowing and lending limits, and fair-sharing information. These pages help answer a more subtle question: Is the Workload blocked because the queue has no quota of its own, because it cannot borrow enough, or because no suitable flavor can be assigned? What we learned without leaving HeadlampFor the sample pending Job, the UI gives us a complete explanation: The Workload is not admitted. Its QuotaReserved condition is false and the message points to insufficient quota. The Workload requests three CPUs and three Pod slots. Its LocalQueue is active and points to the expected ClusterQueue. The ClusterQueue provides only two CPUs and two Pod slots. Kueue therefore keeps the Job suspended until quota becomes available or the queue configuration changes. The important part is not that Headlamp invents a new status. It reads the same Kubernetes API objects as other clients, then places the related resources and human-readable values in one connected investigation. If the Workload is admitted, switch viewsSuppose the Workload detail page shows Admitted=True, but the application is still not running. Kueue has completed its part of the decision. Continue in Headlamp’s standard Kubernetes views: Open Workloads → Jobs and inspect the Job state and events. Open Workloads → Pods and filter by the Job name or namespace. Select a Pending Pod and read its Events section. At this stage, look for scheduler concerns such as insufficient node capacity, node affinity, taints and tolerations, topology constraints, persistent-volume binding, or image-pull failures. This handoff is the most useful troubleshooting rule in the article: Not admitted: investigate Kueue resources in Headlamp. Admitted, but Pods are Pending: investigate Job, Pod, node, and scheduler information in Headlamp. A repeatable Headlamp checklistWhen the next Job does not start, use this short path: Open Kueue → Workloads and select the correct namespace. Find the Workload associated with the Job. Check the readable status, Admitted, and QuotaReserved conditions. Read the condition message and recent events. Compare PodSet resource requests with any admission assignments. Follow the LocalQueue link and confirm its status and ClusterQueue. Follow the ClusterQueue link and compare quota, reservations, usage, and policy. Inspect ResourceFlavor or Cohort details when the message points to flavor selection or shared quota. If admitted, move to Headlamp’s Job and Pod views. What Headlamp replaces during this investigationThe plugin does not replace kubectl or kueuectl for scripts, exact object output, or changes. It replaces the repetitive UI-less navigation needed during an interactive investigation. Question Headlamp path Command-line equivalent Is the Workload admitted? Kueue → Workloads → status and conditions kubectl describe workload <workload-name> -n <namespace> Which LocalQueue did it enter? Workload → linked LocalQueue kubectl get localqueue <localqueue-name> -n <namespace> -o yaml Which ClusterQueue provides quota? LocalQueue → linked ClusterQueue kubectl get clusterqueue <clusterqueue-name> -o yaml Which flavor or shared quota matters? ClusterQueue → ResourceFlavor or Cohort kubectl get resourceflavor <flavor-name> -o yaml or kubectl get cohort <cohort-name> -o yaml What happened after admission? Workloads → Jobs and Pods → events kubectl describe job <job-name> -n <namespace> or kubectl describe pod <pod-name> -n <namespace> For scripts and GitOps workflows, the command line remains the right tool. For a person asking “why is this waiting?”, the linked Headlamp path is usually faster to read. Optional: reproduce the pending scenarioThe plugin repository includes sample Cohort, ClusterQueue, LocalQueue, ResourceFlavor, and Job manifests for local testing. Apply those examples to a cluster where Kueue is installed, then open the Kueue section in Headlamp. To reproduce the specific quota mismatch used in this article, configure a ClusterQueue with two CPUs and two Pod slots, then submit a three-Pod Job that requests one CPU per Pod. The Job enters its LocalQueue, Kueue creates a Workload, and the Workload remains pending because the combined request is larger than the available quota. Keeping this setup separate from the main walkthrough is intentional: once the resources exist, the investigation itself should happen in Headlamp. Current alpha limitationsThe 0.1.0-alpha release is an initial read-only view of the Kueue admission path. The plugin does not add its own create, edit, pause, resume, or delete flows. Workload owner references are displayed as text and are not currently navigable. The UI depends on the Kubernetes permissions of the identity used by Headlamp. Metrics and a visual relationship map are possible follow-up areas rather than features of this release. These limits are useful to state clearly: the plugin’s current purpose is to make admission state and resource relationships easier to inspect. Developed during LFX MentorshipThe plugin was developed during CNCF LFX Mentorship 2026 Term 2 using TypeScript, React, Kubernetes APIs, and Headlamp’s plugin system. Utkarsh Raj implemented the plugin with guidance and review from René Dudfield (@illume) and Kevin Hannon (@kannon92). Feedback from the Headlamp and Kueue communities shaped the resource views, status presentation, navigation, documentation, tests, and first alpha release. Try it and share feedbackExplore the plugin source and README, read the 0.1.0-alpha release documentation, or share feedback in the release issue. If a pending Workload is still difficult to explain after following the Headlamp path, that is exactly the kind of feedback that can improve the plugin.
-
The Shift to cgroup v2 in Kubernetes: What You Need to Know
 on October 6, 2026 at 6:00 pm
In Linux, cgroups (control groups) are a kernel feature used for managing system resources. Kubernetes uses cgroups to allocate resources like CPU and memory to containers, ensuring that applications run smoothly without interfering with each other. With the release of Kubernetes v1.31, support for v1 cgroup management moved into maintenance mode. Support for v2 cgroup management has been stable since Kubernetes v1.25. Compared with cgroup v1, cgroup v2 provides a single unified hierarchy, a more consistent interface, and a stronger foundation for resource isolation and modern resource-management features. Deprecation of cgroup v1Kubernetes has deprecated cgroup v1. Starting with Kubernetes v1.35, failCgroupV1 defaults to true, so the kubelet does not start on a cgroup v1 node by default. Administrators can temporarily set failCgroupV1: false in the kubelet configuration file, but removal will follow the Kubernetes deprecation policy. Further removal work is tracked in KEP-5573: Remove cgroup v1 support. If you are still on a release older than v1.35, migrate every Linux node to cgroup v2 before upgrading, or plan to set the temporary failCgroupV1: false override. If you are already on v1.35 or later, confirm that every Linux node runs cgroup v2 (or that you intentionally keep the override). Under the default configuration, a remaining cgroup v1 node fails during kubelet startup. For kubeadm-managed clusters, Kubernetes v1.35 also makes this an earlier, stricter check. The SystemVerification preflight check, provided by k8s.io/system-validators, returns an error during kubeadm init, kubeadm join, and kubeadm upgrade when it detects cgroup v1 with kubelet v1.35 or later; with an older kubelet, the check remains a warning. See kubernetes/system-validators#1.12.1 release notes for details. The top FAQs cover three main areas: why to migrate, the benefits and drawbacks, and key points to keep in mind when using cgroup v2. Limitations of cgroup v1 and Improvements with cgroup v2The Linux kernel documentation describes both interfaces: cgroup v1 documentation cgroup v2 documentation Let’s enumerate some known issues. active_file memory is not considered available memoryThe kubelet treats active_file memory as not reclaimable. For I/O-intensive workloads, a large page cache can therefore make the kubelet report memory pressure and evict Pods. This is a known kubelet issue (kubernetes/kubernetes#43916); migrating to cgroup v2 does not by itself change that calculation. The documented workaround is to set equal memory requests and limits for containers that perform intensive I/O, after measuring an appropriate value. Memory QoS updates in Kubernetes v1.36Memory QoS was introduced as an alpha feature in Kubernetes v1.22 and updated in v1.27. It remains alpha in v1.36, but now separates memory throttling from memory reservation and adds tiered memory protection: Memory QoS is available only on Linux nodes that use cgroup v2. It relies on the cgroup v2 memory controller: memory.high provides throttling, while memory.min and memory.low provide hard and soft protection when tiered reservation is enabled. cgroup v1 cannot provide this protection model. Enabling the MemoryQoS feature gate applies memory.high throttling to Burstable containers. The threshold is derived from the request, limit, and memoryThrottlingFactor (default 0.9). memoryReservationPolicy: None is the default. It does not write memory.min or memory.low. memoryReservationPolicy: TieredReservation maps Guaranteed Pod memory requests to memory.min (hard protection) and Burstable Pod requests to memory.low (soft protection). BestEffort Pods receive neither protection. The kubelet exposes Alpha metrics for the total memory.min and memory.low reservations on a node. Kernel 5.9 or later is recommended. On older kernels, memory.high reclaim can trigger a known livelock; from v1.36 the kubelet logs a warning when Memory QoS is enabled on an affected kernel. For example, to opt in to tiered protection: apiVersion: kubelet.config.k8s.io/v1beta1 kind: KubeletConfiguration featureGates: MemoryQoS: true memoryReservationPolicy: TieredReservation memoryThrottlingFactor: 0.9 The overall Kubernetes recommendation is not to enable Alpha features in production; however, if you judge that memory QoS with tiered reservations is useful for your platform in production, make sure to test the configuration and account for hard-reserved memory before you enable the TieredReservation feature gate. See the Pod QoS documentation for the current mapping of Kubernetes QoS classes to cgroup v2 controls. Container-aware OOM handlingOn cgroup v2 nodes, the kubelet defaults singleProcessOOMKill to false. It therefore sets memory.oom.group for each container cgroup so that an OOM event kills all processes in that container together, rather than leaving a partially functioning multi-process container. Set singleProcessOOMKill: true only if you need the cgroup v1-compatible behavior where the kernel may kill one process at a time. See the KubeletConfiguration reference for this setting. This behavior is scoped to a container cgroup, not the whole Pod. Also, cgroup.kill is a separate administrative interface: writing 1 to it sends SIGKILL to every process in that cgroup and its descendants; it does not configure OOM behavior. The cgroup v2 memory controller additionally provides memory.events counters that monitoring systems and userspace OOM managers can observe. Rootless supportIn cgroup v1, delegating controllers to less privileged containers may be dangerous. Unlike cgroup v1, cgroup v2 officially supports delegation. Most implementations of rootless containers rely on systemd for delegating v2 controllers to non-root users. This delegation mechanism is separate from Kubernetes Pod user namespaces, which map container users to unprivileged host users. Pod user namespace support graduated to stable in Kubernetes v1.36; check its filesystem, kernel, CRI runtime, and OCI runtime prerequisites before enabling it. What else? eBPF stories: In cgroup v1, device access controls are exposed through interface files. The cgroup v2 device controller has no interface files, and is implemented on top of cgroup BPF. Cilium attaches BPF cgroup programs for socket-based load balancing. Its default cgroup root is /run/cilium/cgroupv2. Pressure Stall Information (PSI) reports CPU, memory, and I/O contention at node, Pod, and container level. On supported clusters, the kubelet exposes PSI by default (KubeletPSI is stable and locked on). PSI requires cgroup v2, Linux 4.20 or later, CONFIG_PSI=y, and a kernel not booted with psi=0. The kubelet surfaces the data through the Summary API and /metrics/cadvisor. When migrating, update software that reads the cgroup filesystem directly. The migration guidance recommends cAdvisor v0.43.0 or later and lists compatible Java, Node.js, and automaxprocs versions. CPU weight conversion in newer OCI runtimescgroup v1 uses cpu.shares, whereas cgroup v2 uses cpu.weight. Newer OCI runtimes use an improved non-linear conversion that preserves the default priority and gives small CPU requests more usable granularity. The change is implemented in the OCI runtime rather than Kubernetes: it is available in crun v1.23 and runc v1.3.2. After upgrading a runtime, monitoring or policy tools that predict exact cpu.weight values may need updates. Read New Conversion from cgroup v1 CPU Shares to v2 CPU Weight for the formula, examples, and compatibility considerations. In-place resource updatesIn-place Pod vertical scaling graduated to stable in Kubernetes v1.35. Kubernetes v1.36 then [enabled] (/blog/2026/04/30/kubernetes-v1-36-inplace-pod-level-resources-beta/) in-place vertical scaling for Pod-level resources by default, as a Beta feature. The kubelet coordinates changes between the Pod-level and container cgroups so that increases create headroom before container limits grow, while decreases constrain containers before shrinking the Pod-level boundary. Accurate aggregate enforcement for this v1.36 feature requires cgroup v2. Adopting cgroup version 2RequirementsHere’s what you need to use cgroup v2 with Kubernetes. First up, you need to be using a version of Kubernetes with support for v2 cgroup management; that’s been stable since Kubernetes v1.25 and all supported Kubernetes releases include this support. You need at least one Linux node; cgroup is a Linux-only concept Your OS install must run with cgroup v2 enabled The kernel version must be 5.8 or later (5.9 or later is recommended when using memory QoS) The container runtime must support cgroup v2. For example: containerd v1.4 or later supports cgroup v2; use containerd v2.0 or later for automatic cgroup-driver discovery CRI-O v1.20 or later The kubelet and the container runtime must both be configured to use the correct cgroup driver. See Configure the kubelet’s cgroup driver to match the container runtime cgroup driver. For now, you can opt back in to use cgroup v1; the Kubernetes project recommends using cgroup v2, but in Kubernetes 1.36 (the current release) the cgroup v1 option remains supported as a fallback. That fallback is scheduled for removal in Kubernetes v1.38. If you are running an older cluster, plan to migrate; if you are setting up a new cluster with Linux nodes, you should prefer cgroup v2. In either case, review both the Kubernetes runtime documentation and (if relevant) the containerd compatibility matrix. kernel updates around cgroup v2When Kubernetes was first announced, in 2014, only v1 cgroup existed. Version 2 cgroup management first appeared in Linux kernel 4.5, released in 2016. In Linux 4.5, the cgroup v2 io, memory, and pids controllers were supported. Linux 4.15 added support for the cgroup v2 cpu controller. Pressure Stall Information (PSI) support began with Linux 4.20. The Kubernetes project does not recommend using cgroup v2 with a Linux kernel older than 5.2 due to lack of cgroup-level task freezer support. Kubernetes documents 5.8 as the minimum kernel version for cgroup v2; the root cgroup’s system-level cpu.stat file was added in Linux 5.8. The memory.high livelock fix used by Memory QoS is present in Linux 5.9 and later. memory.peak was added in Linux 5.19. cgroup driver configurationConfigure the kubelet’s cgroup driver to match the container runtime cgroup driver. If you use kubeadm to manage your cluster, Kubernetes recommends that you use the systemd cgroup driver, because kubeadm manages the kubelet as a systemd service. For other management tooling, check the documentation for the tool you’re using to manage your cluster. If you can pick either option, I recommend using the systemd driver. Whatever tooling you’ve chosen, the kubelet automatically tries to detect the runtime’s recommended cgroup driver. This automatic detection relies on using a runtime that implements the RuntimeConfig CRI RPC (for example: containerd v2.0+ or CRI-O v1.28+). If you’re using a container runtime that supports cgroup v2 but doesn’t support automatic cgroup driver detection, you can manually configure an override by editing the kubelet configuration file. For example: apiVersion: kubelet.config.k8s.io/v1beta1 kind: KubeletConfiguration cgroupDriver: systemd Automatic discovery of the runtime’s cgroup driver through the CRI, tracked by KEP-4033, graduated to stable in Kubernetes v1.34. It requires a runtime that implements the RuntimeConfig CRI RPC (containerd v2.0+ or CRI-O v1.28+). When available, the kubelet uses the value reported by the runtime instead of its configured cgroupDriver value. Tools and commands for troubleshootingTools and commands that you should know about cgroups: stat -fc %T /sys/fs/cgroup/: Check whether cgroup v2 is enabled; it returns cgroup2fs. systemctl list-units ‘kube*’ –type=slice or –type=scope: List Kubernetes-related units that systemd currently has in memory. bpftool cgroup list /sys/fs/cgroup/*: List all programs attached to the cgroup CGROUP. systemd-cgls /sys/fs/cgroup/*: Recursively show control group contents. systemd-cgtop: Show top control groups by their resource usage. tree -L 2 -d /sys/fs/cgroup/kubepods.slice: Show Pods’ related cgroups directories. How to check if a Pod CPU or memory limit is successfully applied to the cgroup file?Work from the API object down to the node. Identify the node, then compare desired resources in the spec with the enacted values in status (in-place resize can leave those out of sync): kubectl get pod <pod-name> -n <namespace> \ -o jsonpath='{.spec.nodeName}{“\n”}’ kubectl get pod <pod-name> -n <namespace> \ -o jsonpath='{range .spec.containers[*]}{.name}{” spec\t”}{.resources}{“\n”}{end}’ kubectl get pod <pod-name> -n <namespace> \ -o jsonpath='{range .status.containerStatuses[*]}{.name}{” status\t”}{.resources}{“\n”}{end}’ On that node, as root, with the systemd cgroup driver and cgroup v2 (these snippets also need jq). Pin the container with kubelet labels; a container name alone is not unique on a node. Use crictl ps -a if the container is not running: CONTAINER_ID=$(crictl ps \ –label io.kubernetes.pod.namespace=<namespace> \ –label io.kubernetes.pod.name=<pod-name> \ –name <container-name> -q | head -n1) # OCI view (not the CRI protobuf field names) crictl inspect “$CONTAINER_ID” | jq ‘.info.runtimeSpec.linux.resources’ # Kernel cgroup path for this container PID=$(crictl inspect “$CONTAINER_ID” | jq -r ‘.info.pid’) CGROUP=”/sys/fs/cgroup$(awk -F: ‘$1==”0″{print $3}’ /proc/$PID/cgroup)” cat “$CGROUP/cpu.weight” # request.cpu → shares → weight; not a limit cat “$CGROUP/cpu.max” # limit.cpu as “quota period”; unlimited is “max <period>” cat “$CGROUP/memory.max” # limit.memory; unlimited is “max” # Pod-level cgroup (parent slice), used by Pod-level resources cat “$(dirname “$CGROUP”)/cpu.max” “$(dirname “$CGROUP”)/memory.max” # Present when MemoryQoS is enabled cat “$CGROUP/memory.high” “$CGROUP/memory.min” “$CGROUP/memory.low” SCOPE=$(basename “$CGROUP”) systemctl show “$SCOPE” \ -p CPUWeight -p CPUQuotaPerSecUSec -p CPUQuotaPeriodUSec -p MemoryMax Do not treat info.runtimeSpec.linux.cgroupsPath as a filesystem path when the runtime uses the systemd driver; that value is a systemd unit path (slice:runtime:id), not a directory under /sys/fs/cgroup. Expected mapping at each layer: Kubernetes: spec.containers[*].resources (desired) and status.containerStatuses[*].resources (enacted after in-place resize). Pod-level resources are on spec.resources and the parent pod slice. CRI (kubelet → runtime; these protobuf names stay cgroup v1-style even on v2): cpu_shares, cpu_quota, cpu_period, memory_limit_in_bytes, plus unified for Memory QoS. crictl inspect does not show these names; it shows the OCI spec the runtime derived from them. OCI spec: linux.resources.cpu.{shares,quota,period}, linux.resources.memory.limit, and linux.resources.unified. The runtime converts shares, quota, and period into cgroup v2 files. After upgrading crun or runc, the shares-to-weight formula may change; see CPU weight conversion. systemd scope: CPUWeight, CPUQuotaPerSecUSec, CPUQuotaPeriodUSec, MemoryMax. Unlimited or unset values often appear as [not set] or infinity. cgroupfs: cpu.weight (from CPU request; an unset request still yields the default of 2 shares), cpu.max, and memory.max on the container scope. Memory QoS adds memory.high, memory.min, and memory.low. Further reading Kubernetes 1.31: Moving cgroup v1 Support into Maintenance Mode Kubernetes v1.36: Tiered Memory Protection with Memory QoS Kubernetes v1.36: PSI Metrics for Kubernetes Graduates to GA Kubernetes 1.25: cgroup v2 graduates to GA KubeCon NA 2022 cgroup v2: Before You Jump In by Tony Gosselin & Mike Tougeron, Adobe Systems KubeCon NA 2022 Cgroupv2 Is Coming Soon To a Cluster Near You – David Porter, Google & Mrunal Patel, RedHat KubeCon EU 2020 Kubernetes On cgroup v2 by Giuseppe Scrivano, Red Hat. This blog only covers the basic requirements and configuration of Kubernetes components. It will not include how to enable cgroup fs in OS distributions. For migration, you can refer to migrating cgroup v2
-
Scaling Kubernetes Workloads with Node Swap
 on October 5, 2026 at 6:00 pm
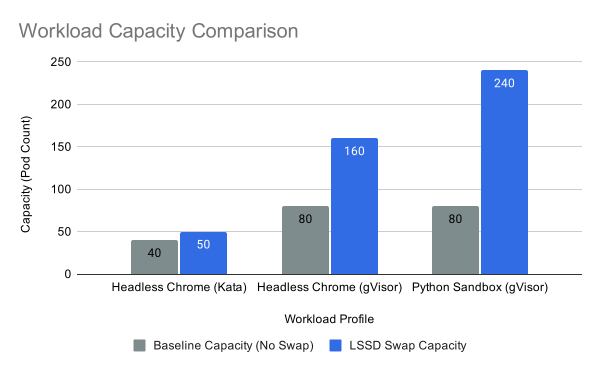
Memory is often the first hard limit a Kubernetes cluster hits. Nodes run out of RAM long before they run out of CPU, and the new wave of agentic AI workloads makes this worse. These workloads demand large memory footprints to start up and run untrusted code, then sit idle waiting for the next prompt. That idle but resident memory is expensive, and it caps how many pods a node can hold. This is where swap helps. Kubernetes support for running nodes with swap enabled reached General Availability in v1.34, and by backing that swap with fast NVMe solid state drives (SSDs), a node can page out dormant memory and pack in far more pods. This post explains how we benchmarked that approach across three workloads, including CI/CD kernel builds, sandboxed headless browsers, and isolated Python runtimes; we found density gains of up to 3×, often with little or no latency cost. The node density problemThe Kubernetes ecosystem has reached a fundamental physical resource constraint: the strict limits of hardware memory versus the growing demand for dynamic, bursty workloads in the new agentic era. Historically, administrators provisioning memory-intensive workloads encountered a persistent dilemma: set memory limits too high and you waste expensive infrastructure on idle RAM; set them too low and you risk Out-Of-Memory (OOM) kills. This conflict is amplified when deploying autonomous AI agents using secure execution environments like the agent-sandbox framework. These agentic pods require large memory footprints to initialize and execute untrusted code. However, after their burst of activity, they typically enter long-tail idle phases waiting for user prompts. Keeping this idle state in physical RAM caps cluster density and makes AI infrastructure expensive to run. The solution: Kubernetes node swapWith the introduction of Kubernetes’ support for running nodes with swap enabled (which reached General Availability in v1.34), this paradigm shifts. By enabling the Linux kernel to page out anonymous memory to disk, node swap acts as a shock absorber during traffic spikes or periods of heavy memory oversubscription. Historically, swap was discouraged in Kubernetes for two reasons. The first was memory accounting. Under cgroup v1, the controls treated memory and swap as a single combined limit rather than letting operators set an independent limit for disk swap. Without independent tracking, a process could page large amounts of anonymous memory out to disk, which made a container’s real memory usage unpredictable and hard to isolate. Kubernetes’ swap support resolves this by relying on cgroup v2, whose separate swap accounting tracks disk swap on its own. The second reason was the latency penalty of paging to slow spinning disks, which fast NVMe Local SSDs largely eliminate. Together, these make it practical to increase pod density and buffer against memory spikes without sacrificing cluster stability. The benchmark dataTo quantify the performance boundaries and cost-saving potential of Local SSD-backed node swap, this analysis covers three distinct workload categories: a Traditional Build Workload for CI/CD pipelines, High-Density Browser Sandboxes, and Isolated Python Sandboxes. Workload Profile Baseline Capacity (No Swap) Local SSD Swap Capacity Density Improvement Linux CI/CD Kernel Build 600 MB RAM Limit 300 MB RAM Limit -50% RAM Footprint Headless Chrome (Kata) 40 Concurrent Pods 50 Concurrent Pods +25% Pod Density Headless Chrome (gVisor) 80 Concurrent Pods 160 Concurrent Pods +100% Pod Density Python Sandbox (gVisor) 80 Concurrent Pods 240 Concurrent Pods +200% Pod Density 1. Traditional workload: Linux kernel buildBefore exploring specialized agentic architectures, swap was validated against classic batch workloads by running a complete Linux 6.1.1 kernel build. The kernel compilation process leverages concurrent worker threads, balloons in memory to hold compiled object files, and requires a large memory spike during the brief linking phase. This workload mirrors the memory behavior of enterprise CI/CD pipelines. Because earlier compiled objects sit inactive in memory while the pipeline progresses, CI/CD jobs frequently hoard unused physical RAM, which makes them well suited to node swap compression. On a baseline node without swap, the minimum memory limit to prevent an OOM crash during compilation was 600 MB. Routing swap to a Local SSD cut the container memory limit by 50% to 300 MB without incurring any execution slowdown (in fact, it ran cleanly in 374s vs the baseline 433s). However, as an explicit tradeoff, compressing the limit further to 200 MB forced the active working set into swap, causing long I/O wait times and increasing execution time by over 40%. This reinforces that swap serves as an insurance policy for burst memory, not a replacement for active RAM. 2. High-density agent workloads: headless browser runtimesAI agent workloads frequently require manipulating headless browsers via Chromium. However, trusting external code execution often requires stricter security isolation than standard Linux namespaces. This benchmark cross-evaluated several container runtime environments. The raw logs and testing methodologies for the default runtime are available in the Agent Sandbox GKE Swap directory. Unsandboxed baseline limits (runc): To test the limits of the environment without the overhead of security runtimes, plain runc containers were swept on a c4-standard-32 node (32 vCPU, 120 GB RAM). Without swap, the node exhausted physical memory and failed past 512 pods. Enabling Local SSD swap allowed the node to support 768 concurrent pods. Advanced security runtimes (for example: gVisor, Kata Containers): Enabling strict security sandboxing increases memory overhead and normally reduces pod density. However, memory swap naturally absorbs this overhead penalty. Without swap, a gVisor environment hit a hard limit at 80 pods. Local SSD swap doubled that capacity, which allowed 160 concurrent gVisor pods on a single node. Similarly, Kata Containers microVMs exhausted physical RAM at 40 concurrent pods without swap, but using GCP Local SSD swap expanded this to 50 stable Kata microVMs before CPU saturation. At these maximum densities, the per-pod latency increase is driven mainly by pods competing for CPU, not by swap I/O. An operator tuning for a specific latency target would run at a lower density than the peak numbers here and see a proportionally smaller latency cost. For a comprehensive architectural breakdown and density metrics for gVisor and Kata, see the Agent Sandbox GKE Swap Runtimes directory. 3. Beyond browsers: sandboxed Python runtimesThe advantages of node swap also extend to untrusted, isolated code-execution environments. This sweep deployed simultaneous Python sandbox sessions analyzing 5 million rows of data from the MovieLens 20M dataset, requiring a ≃375 MiB resident memory footprint per execution. The in-depth scaling results and deployment code for this sweep can be reviewed in the Agent Sandbox GKE Swap Python Density directory. Without swap, heavy concurrent bursts exhausted physical memory, causing the node to hit a hard RAM limit and fail at 80 concurrent sessions. Enabling Local SSD swap offloaded dormant anonymous memory, freeing up physical RAM and preserving the node’s page cache. This allowed the node to scale to 240 concurrently isolated Python sandboxes—a 3× density improvement. As with the browser workloads, the latency rise at peak density comes mainly from the sandboxes competing for CPU rather than from swap itself. Density Benchmarks with and without Node Swap How to use itIf you manage Kubernetes infrastructure for developer environments, browser testing farms, JVM applications, or AI execution runtimes, leveraging Local SSD swap can multiply your density efficiency. In Kubernetes v1.34+, node swap is Generally Available. You enable it via the kubelet configuration: kind: KubeletConfiguration apiVersion: kubelet.config.k8s.io/v1beta1 failSwapOn: false memorySwap: swapBehavior: LimitedSwap Pairing this upstream configuration with your cloud provider’s high-speed local disk gives you dynamic memory balancing. For example, this is natively supported on Google Kubernetes Engine via Node Memory Swap configured on Local SSD profiles. To get the benefits, configure your workloads with Burstable QoS: set your container’s memory limits higher than its requests. The node automatically rations fast swap space based on idle application memory usage while keeping active processes responsive. ConclusionAs the Kubernetes ecosystem transitions into the agentic era, administrators face a growing conflict between finite hardware memory limits and the bursty behavior of AI workloads. Frameworks like Agent Sandbox provide the security isolation required for running untrusted agents, but that isolation traditionally demands large amounts of idle memory overhead. By configuring the kubelet with LimitedSwap and routing it to Local SSDs, you can mitigate this conflict. Fast swap offloads the dormant states of idle agents, allowing you to increase pod density and node utilization on the same infrastructure without compromising security boundaries.
-
Spotlight on SIG Apps
on September 22, 2026 at 6:00 pm
As Kubernetes adoption has grown, the conversation has shifted beyond running containers to managing increasingly complex application lifecycles. Modern platforms support stateless web services, stateful databases, batch processing, AI workloads, and platform services. At the same time, they must remain reliable during upgrades, scaling events, and infrastructure failures. Every Kubernetes user relies on SIG Apps, whether they realize it or not. Deployments, StatefulSets, DaemonSets, Jobs, and CronJobs form the foundation of how applications are deployed, updated, scaled, and operated across the Kubernetes ecosystem. SIG Apps is focused on improving workload resilience, refining application lifecycle management, and addressing the operational challenges that emerge when applications encounter node failures, rollout disruptions, and increasingly complex infrastructure environments. In this spotlight, we sit down with two of the three SIG Apps chairs Janet Kuo and Maciej Szulik to discuss the evolution of Kubernetes workload management, the challenges of balancing application reliability with operational simplicity, and the future of application lifecycle management within one of Kubernetes’ most influential Special Interest Groups. Introducing SIG AppsNatalie Fisher: Can you introduce yourself, your role, and how you got involved in SIG Apps? Janet Kuo: I’m a Senior Staff Software Engineer at Google and have been a Kubernetes maintainer since 2015, joining the community just as we were racing toward the 1.0 launch. In those early days, my focus was on building the core Workloads API, specifically developing controllers like Deployment, ReplicaSet, StatefulSet, and DaemonSet, defining their rollout behaviors, and bringing them from initial designs to GA. That hands-on work was my entry point into SIG Apps. Since then, I’ve stayed deeply involved in both the technical and community sides of Kubernetes. I have led SIG Apps as Co-Chair and Tech Lead since 2019. Currently, in addition to maintaining the workloads API, I am driving new subprojects like the Agent Sandbox to ensure Kubernetes is ready for next-generation agentic and AI workloads. Maciej Szulik: I started contributing to Kubernetes all the way back in 2014. Since then, I’ve worked across various areas of the project: controllers, kubectl, and apimachinery, which eventually led me to become one of the Chairs and Tech Leads for SIG Apps. My current focus is reliability of the workload controllers under the SIG Apps umbrella and stability and ease of use of kubectl as part of my SIG CLI Tech Lead role. I also care about overall community health and growth as part of my Steering Committee role. Outside of Kubernetes, I work as a Staff Platform Engineer at Defense Unicorns, where I’m helping make Kubernetes more airgap-native with a project called zarf. The problem and the solutionSIG Apps is responsible for the core workload APIs that power how applications run on Kubernetes. From Deployments and StatefulSets to Jobs and CronJobs, these controllers determine how workloads are created, updated, scaled, and recovered when things go wrong. As Kubernetes expands to support increasingly diverse workloads – including AI, batch processing, and large-scale distributed applications – SIG Apps continues to evolve these APIs while balancing reliability, backward compatibility, and operational simplicity. NF: For readers who may not be familiar, what is SIG Apps, and what role does it play within the broader Kubernetes ecosystem? MS: SIG Apps is the Kubernetes Special Interest Group responsible for the workloads APIs. CronJob and Job help running batch workloads, whereas DaemonSet, Deployment, ReplicaSet, and StatefulSet serve the majority of other applications. More broadly, SIG Apps owns the layer most developers actually touch day-to-day: the controllers that turn a workload specification into running, self-healing pods. It’s the group deciding how Deployments roll out, how Jobs retry, how DaemonSets place a pod per node. JK: Adding to what Maciej described, as the industry shifts, we are seeing a massive demand to run complex, non-traditional workloads like distributed AI training, batch computing, and dynamic agent environments. Our role is expanding: we aren’t just maintaining the classic workloads API, but we are actively evolving it and establishing new patterns (like the Agent Sandbox) to make sure Kubernetes remains the best platform for the next generation of workloads, such as AI. NF: Looking at the workload APIs owned by SIG Apps (Deployments, StatefulSets, DaemonSets, Jobs, and CronJobs), which areas are receiving the most attention from maintainers and contributors? MS: After a long stretch focused on making batch workloads run smoothly on Kubernetes, we’ve shifted attention to make sure serving workloads (DaemonSets, StatefulSets, etc) aren’t left behind. This means performance and high-scale improvements to rollout and scaling behavior, plus working through our backlog of user-reported issues, prioritizing the ones with the strongest support from the user base. Current focus areasAs Kubernetes workloads grow in scale and complexity, the challenges facing workload controllers evolve as well. We asked the SIG Apps chairs where contributors are focusing their efforts today and which resilience problems they believe are the highest priorities. NF: From your perspective, what are the most important workload resilience problems SIG Apps is trying to solve today? MS: Node lifecycle challenges have come up repeatedly across SIG Apps, SIG Node, and SIG Autoscaling discussions. DaemonSets and Jobs are just where the pain is most visible, since they’re the workloads most directly bound to node state. Rather than solve it piecemeal within one SIG, we’ve settled on spinning up a dedicated Node Lifecycle Working Group to focus on this properly and hopefully land long-term solutions instead of one-off patches. JK: From an AI perspective, resilience is critical. When you are running a massive distributed LLM training job that spans hundreds of GPUs, a single node failure can halt the entire pipeline. Similarly, if a DaemonSet that runs your logging or GPU monitoring agent gets stuck on a bad node, it impacts the entire cluster’s health. In addition to the work in the Node Lifecycle WG to handle infrastructure-level degradation, SIG Apps is addressing this at the orchestration layer through subprojects like JobSet (for distributed training) and LeaderWorkerSet (LWS) (for sharded LLM inference). These APIs introduce patterns like “all-or-nothing” failure handling, where a single pod or job failure triggers a coordinated group-level restart to resume from the last clean checkpoint, rather than letting stuck workloads hang in an inconsistent state. Real-world impactThe work happening within SIG Apps extends far beyond controller implementations and API design. We wanted to understand what these improvements mean in practice for platform teams operating Kubernetes clusters in production. NF: For platform teams operating Kubernetes in production, what practical improvements would they notice if the node lifecycle and workload resilience work currently under discussion is successfully delivered? MS: I’m mostly looking from the sidelines, the folks actually in the Node Lifecycle Working Group would give you a sharper answer. But from where I sit, I’m hoping their work translates into fewer 3am pages that turn out to be “a DaemonSet rollout got stuck because node X was flaky, and someone had to manually cordon/delete/restart to unstick it.” JK: +1 to what Maciej said, and beyond reducing manual intervention, platform teams will also see much better resource predictability and cost efficiency. For example, in AI workloads where GPU idle time is extremely expensive, having Kubernetes automatically detect a degraded node and reschedule the training coordinator or agent before the job crashes means less wasted compute and more stable job execution. Challenges and trade-offsEvolving APIs that millions of workloads rely on requires careful engineering and even more careful decision-making. We asked the SIG Apps chairs about the technical and operational trade-offs they weigh when introducing changes to Kubernetes’ core workload controllers. NF: What are some of the hardest technical or operational trade-offs SIG Apps encounters when evolving core workload controllers? MS: Honestly, a few tensions keep coming up: how aggressively a controller should give up on stuck pods, and what signals it actually needs to make that call correctly. At the same time, we always have to think about backward compatibility. Deployment, DaemonSet, and Job behavior has been depended on for a decade [by Kubernetes users, tooling, automation, and higher-level controllers], so even a change that’s clearly “more correct” can break automation people built around the old behavior without meaning to. JK: One of our hardest trade-offs is resisting the urge to make “elegant” design changes that break backward compatibility. Instead, we have to design opt-in features that let users adopt new behaviors without forcing them on legacy workloads. When we need to support completely new paradigms, we prefer introducing them as CRDs first rather than bloating the core APIs, like we are doing with Agent Sandbox, JobSet, and LWS. Looking aheadWhile much of SIG Apps’ work focuses on maintaining the stability of existing workload APIs, the group is also shaping the future of Kubernetes through new enhancements and proposals. We concluded by asking about one proposal that recently returned to active development and what it represents for the future of workload management. NF: The SIG recently discussed reviving KEP-4443 with a target release of Kubernetes 1.38. What opportunities or challenges does this proposal aim to address, and why is now the right time to revisit it? KEP-4443 addresses a small but real gap in the Job API: a PodFailurePolicy can be configured to add a condition reason to the JobFailed condition, but different pod failure policy rules targeting different container exit codes all produce that same generic reason. The proposal is simple: an optional Name field on each PodFailurePolicyRule, which gets appended to the JobFailed condition reason, so higher-level tools like JobSet can finally react differently depending on which rule triggered the failure. As for timing, the answer is as simple as it always is in open source: we lost the original contributor who was driving this. Now we’ve got someone new interested in picking it up, that’s why we’re targeting the next release. Getting InvolvedNF: For someone interested in contributing to SIG Apps, where would you recommend they start, especially if they are not yet a Kubernetes maintainer? MS: The best place to start is the #sig-apps slack channel and our regular SIG Apps meetings. We’ve all started there, and if it feels intimidating, or nobody replies right away, that’s completely normal. Everyone’s busy. It’s not personal. JK: In addition to what Maciej answered, I’d suggest looking at our newer subprojects and initiatives. Contributing to stable APIs like Deployment or StatefulSet can be daunting because the barrier for making changes is very high due to backward compatibility, and there is much less low-hanging fruit. If you are new to the community, projects like the Agent Sandbox are fantastic entry points. They are actively evolving, have a friendly group of maintainers, and offer plenty of greenfield development opportunities where you can make a significant impact quickly. SummarySIG Apps has shaped how Kubernetes applications are deployed and operated since the project’s earliest days. While users often interact with Deployments, StatefulSets, Jobs, and DaemonSets without thinking about the controllers behind them, the work within SIG Apps continues to shape the reliability and scalability of workloads across the Kubernetes ecosystem. From improving workload resilience and node lifecycle behavior to enabling new patterns for AI and distributed computing, the SIG is evolving Kubernetes while remaining committed to one of the project’s core principles: preserving the stability and backward compatibility that users depend on. Whether you’re interested in core workload APIs, emerging projects like Agent Sandbox, or helping improve the operational experience of Kubernetes users everywhere, SIG Apps offers many opportunities to get involved.
-
Kubernetes v1.37: Tracking When a PersistentVolumeClaim Was Last Used (Beta)
on September 21, 2026 at 6:30 pm
Kubernetes v1.37 promotes the PersistentVolumeClaimUnusedSinceTime feature gate to Beta (enabled by default). With this feature, the PersistentVolumeClaim (PVC) protection controller adds an Unused condition to each PVC, telling you whether any running pod currently references it — no custom tooling or cross-referencing required. For the API definition of PVC conditions, see the PersistentVolumeClaim API reference. Read on to learn how the Unused condition works and how to use it. Why track PVC usage?In large-scale Kubernetes clusters, it is common for users to create PVCs and then delete the associated pods without cleaning up the storage, because Kubernetes does not automatically delete PVCs when their pods are removed (to protect against accidental data loss). Over time, these orphaned PVCs may accumulate, silently consuming storage capacity and driving up cloud costs. Before Kubernetes v1.37, it was easy to identify an unused PersistentVolume, but much harder to determine whether a PVC was still being used. Doing so required cross-referencing pods, PersistentVolumes, and PVCs over a potentially large window of time. Administrators often resorted to custom monitoring pipelines or scripts to answer a seemingly simple question: “Is anything actually using this volume?” The PersistentVolumeClaimUnusedSinceTime feature solves this by making the answer available natively in the PVC status. Once the feature is enabled, every PVC gets an Unused condition managed by the PVC protection controller. User stories Storage administrator: “I want to know which PVCs in my cluster are not being used by any pod so I can safely identify orphaned volumes and schedule them for deletion.” DevOps engineer: “I want to list PVCs that have the Unused condition set to True so I can automate cleanup in development environments.” How does it work?The PVC protection controller — which already watches pods to enforce the storage object in use protection — now also manages a new Unused condition on PVCs. The condition works as follows: Scenario Condition status Reason No non-terminal pods reference the PVC Unused=True NoPodsUsingPVC At least one running or pending pod references the PVC Unused=False PodUsingPVC A few details worth noting: Terminated pods don’t count: A pod that has completed (phase Succeeded or Failed) does not keep the PVC marked as in use. This means batch jobs with restartPolicy: Never won’t prevent the PVC from becoming Unused=True after they finish. Pending pods do count: Even an unschedulable pod (for example, one with an impossible node selector) still counts as using the PVC. The intent to use the volume is enough. Multiple pods: If several pods reference the same PVC, the condition transitions to Unused=True only after the *last” non-terminated pod is removed or terminates. Using lastTransitionTime to find when a PVC became idleLike every Kubernetes condition, the Unused condition carries a standard lastTransitionTime field. This means you get a useful bonus for free: when the condition transitions from False to True, the lastTransitionTime records exactly when the PVC became idle. You can use this timestamp to answer questions like “how long has this PVC been sitting unused?” — for example, to find PVCs that have been idle for more than 30 days (see the example query below). What changed from Alpha to Beta?Kubernetes v1.36 introduced this feature as Alpha, where you had to enable the PersistentVolumeClaimUnusedSinceTime feature gate explicitly. For Beta in v1.37, the feature gate is enabled by default, and the feature has full end-to-end test coverage. How to use itSince the feature is Beta and enabled by default in Kubernetes v1.37, the Unused condition will appear on PVCs automatically. Here is a walkthrough to see it in action: Create a PVC: apiVersion: v1 kind: PersistentVolumeClaim metadata: name: my-data spec: accessModes: – ReadWriteOnce resources: requests: storage: 1Gi After a short time, inspect the PVC conditions: kubectl get pvc my-data -o jsonpath='{.status.conditions[*]}’ | jq . You should see an Unused condition with status True and reason NoPodsUsingPVC: { “lastProbeTime”: null, “lastTransitionTime”: “2026-09-14T12:03:11Z”, “message”: “No pods are currently referencing this PVC”, “reason”: “NoPodsUsingPVC”, “status”: “True”, “type”: “Unused” } Create a pod that uses the PVC: apiVersion: v1 kind: Pod metadata: name: my-app spec: containers: – name: app image: busybox command: [“sleep”, “3600”] volumeMounts: – name: data mountPath: /data volumes: – name: data persistentVolumeClaim: claimName: my-data Check the condition again — it should now show Unused=False: kubectl get pvc my-data -o jsonpath='{.status.conditions[?(@.type==”Unused”)].status}’ Output: False Delete the pod and wait for the condition to transition back to Unused=True: kubectl delete pod my-app kubectl get pvc my-data -o jsonpath='{.status.conditions[?(@.type==”Unused”)]}’ The condition should show Unused=True with reason NoPodsUsingPVC again. Finding unused PVCs across the clusterTo list all PVCs that have been unused for more than 30 days, you can use a command like: Note:This command uses jq, a command-line JSON processor. kubectl get pvc -A -o json | jq -r ‘ .items[] | select(.status.conditions[]? | select(.type==”Unused” and .status==”True”)) | select( (.status.conditions[] | select(.type==”Unused”) | .lastTransitionTime) as $t | (now – ($t | fromdateiso8601)) > (30 * 86400) ) | “\(.metadata.namespace)/\(.metadata.name) unused since \(.status.conditions[] | select(.type==”Unused”) | .lastTransitionTime)” ‘ What’s next?Depending on feedback and adoption, the Kubernetes project intends to graduate this feature to General Availability (GA) in a future release. If you have feedback on this feature, please open an issue in the kubernetes/kubernetes repository. To learn more about this enhancement, refer to KEP-5541: PersistentVolumeClaim last used time. Getting involvedThe Kubernetes project always welcomes new contributors. If you would like to get involved, you can join us at SIG Storage. If you would like to share feedback, you can do so on our public Slack channel (visit https://slack.k8s.io/ for an invitation if you need one). Special thanks to the contributors who helped design and implement this feature (alphabetical order): Arvind Parekh (ArvindParekh) Hemant Kumar (gnufied) Jan Šafránek (jsafrane) Kevin Hannon (kannon92) Roman Bednář (RomanBednar)